NRS have published the latest Population Projections for Scottish Areas. They are based on the latest mid-2016 population estimates and provide an indication of the future population size and age structure of Scottish areas based on a set of assumptions about future fertility, mortality and migration.
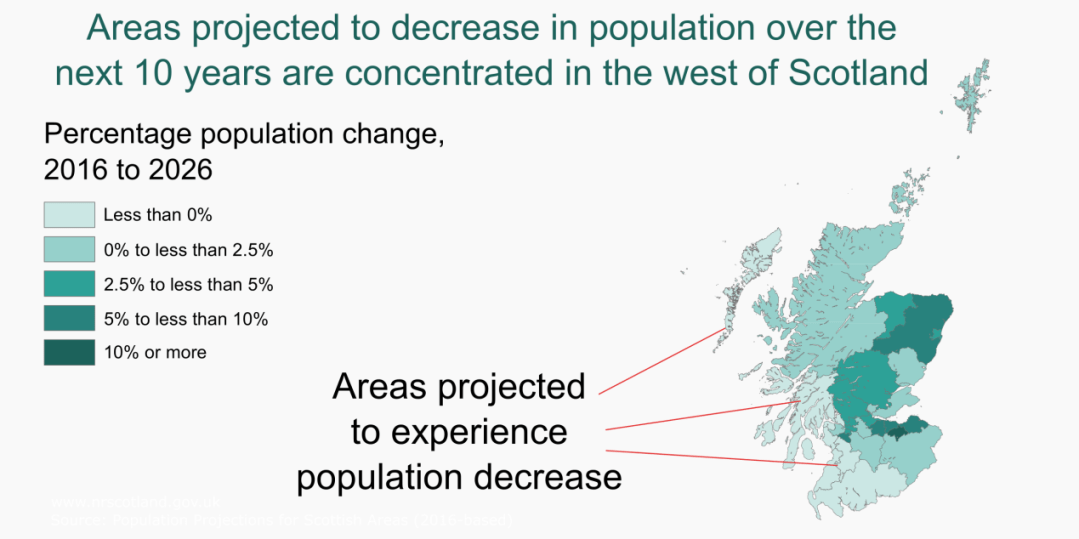
The projections show that overall, the population of Scotland is projected to increase by 3% between 2016 and 2026. The majority of Scotland’s councils – 24 of the 32 councils – are projected to increase in population over the next decade. However, this means a quarter of Scotland’s councils – 8 councils – are projected to decline in population over the same period.
Of the council areas projected to experience a fall in population, Na h-Eileanan Siar (-5%), Inverclyde (-4%) and Argyll and Bute (-3%) are projected to have the largest decreases. The areas projected to decrease in population are concentrated in the west of Scotland. North, East and South Ayrshire, Dumfries and Galloway and West Dunbartonshire are also projected to experience falls in population over the next ten years.
What is driving projected depopulation in specific areas?
The two main components of population change are net migration (the number of people moving to an area to live minus the number of people leaving) and natural change (the number of births minus the number of deaths).
Most of the areas facing depopulation are projected to experience small population increases due to net migration. Of these areas, only South Ayrshire (+3.7%) has a bigger increase in population due to net migration than the average for Scotland (+3.4%).
However, all of these areas are projected to experience negative natural change (more deaths than births) over the next ten years which offsets any increase due to net migration. The chart below shows the contribution of natural change and net migration to the projected population between 2016 and 2026.

Changing age structures
It is also helpful to understand how the age structure of each council is projected to change. We know that the population across all of Scotland is ageing. This means there will be increased pressures on social services, increasing the demand for people of working age to provide these services and taxpayers to fund them.
One way of understanding the changing age structure of Scotland is to consider each council area’s projected percentage change in total population alongside the percentage change in the proportion of the population of working age. This provides a very simplistic measure of potential demographic sustainability. It is of course much more complex in reality and we should avoid assuming that all older people are dependent on the working age population. Nevertheless this is a useful way of examining the relative age structure of the population and understanding whether working age populations will grow, or not, and how this compares with the change in total population.

The eight councils projected to decrease in population are also projected to have a smaller proportion of working age people in ten years’ time – they are shown in the chart above in Cluster 3.
The areas in Cluster 1 are projected to increase in population, but the share of their population of working age is projected to fall. While not facing depopulation, these areas may face some of the same challenges regarding pressures on services as the areas in Cluster 3.
The areas in the strongest position demographically are those in Cluster 2. These areas are projected to see increases in their total population and in the proportion of their population of working age.
There are no council areas in Cluster 4, which would include areas projected to decrease in population and increase the proportion of working age population.
Further information
If you would like to find out more, the full publication, key findings and interactive data visualisation for the Population Projections for Scottish Areas (2016-based) are available on our website.
William Howes
Assistant Statistician
Population & Migration Statistics
National Records of Scotland
